Infographics Use Food To Show The Wildly Differing Rents In America
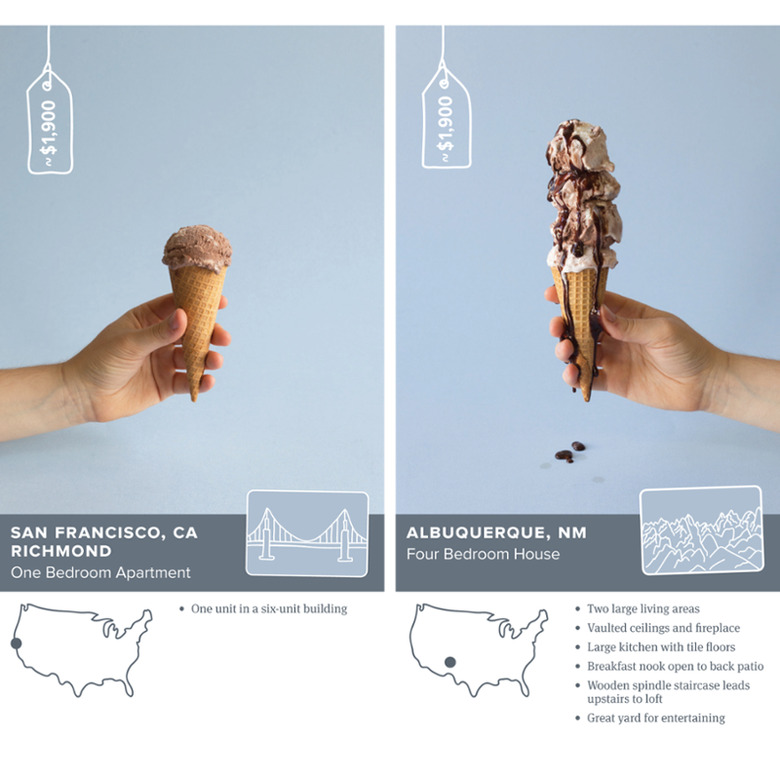
Designer Annalisa van den Bergh has used familiar foods to compare housing prices in San Francisco, where she currently resides, to other cities throughout the country. And the results, depending on where you live, might make your stomach tighten a bit. Culling facts and information from the housing-specific website Lovely, Van der Bergh teamed up with photographer Sierra Hartman to design a series of images for The Bold Italic that place the cost of a studio or one-bedroom apartment in various San Francisco neighborhoods side-by-side with the same price tag in another U.S. city — visually told through proportionate food items like ice cream, popcorn and cereal. For example, a $1,900 one-bedroom apartment in SF's Richmond district would fetch a 4-bedroom house in Albuquerque, New Mexico. That's the equivalent of a paltry single-scoop ice cream cone compared to a towering four-scoop cone dripping with chocolate sauce. (Maybe at least the SF ice cream is artisanal?)
Infographics have always been useful tools to quickly convey fast facts in a visual manner, but something about breaking statistics down by food — a basic, familiar need that's relative to all of us — really drives the point home.
-
Designer Annalisa van den Bergh has used familiar foods to compare housing prices in San Francisco, where she currently resides, to other cities throughout the country. And the results, depending on where you live, might make your stomach tighten a bit.